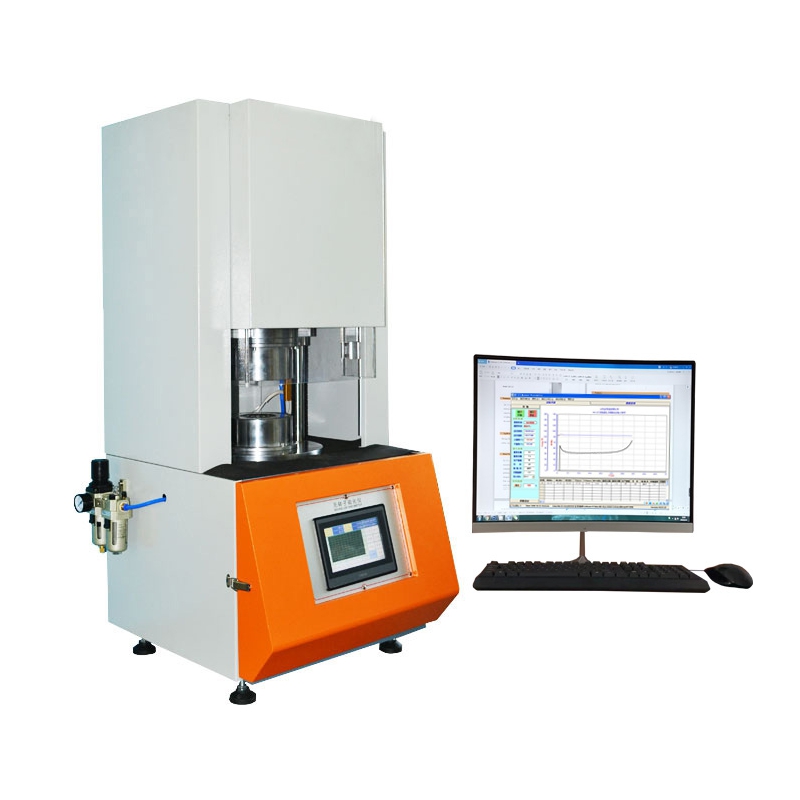
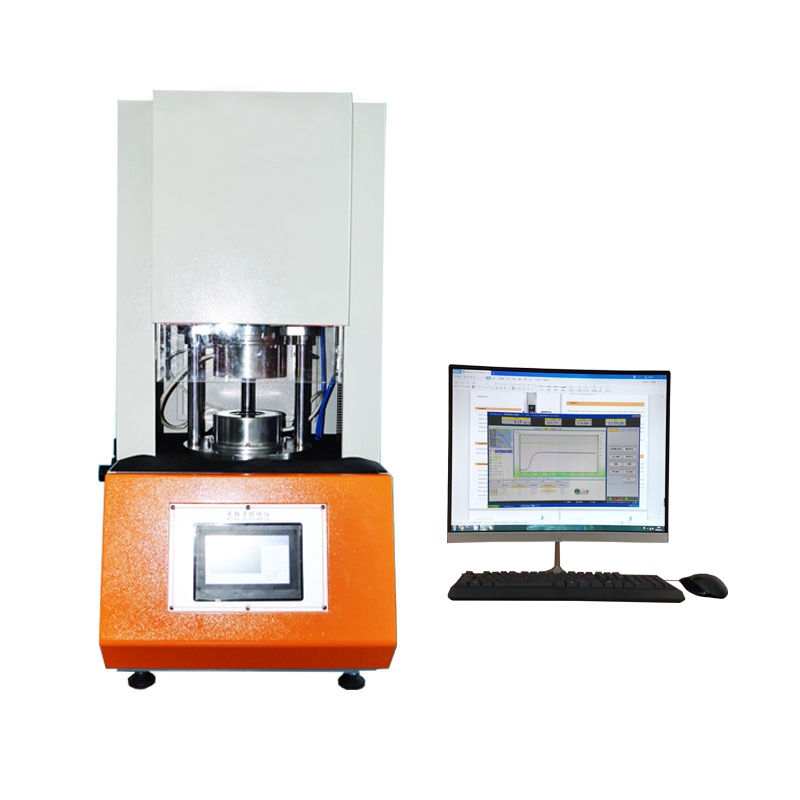
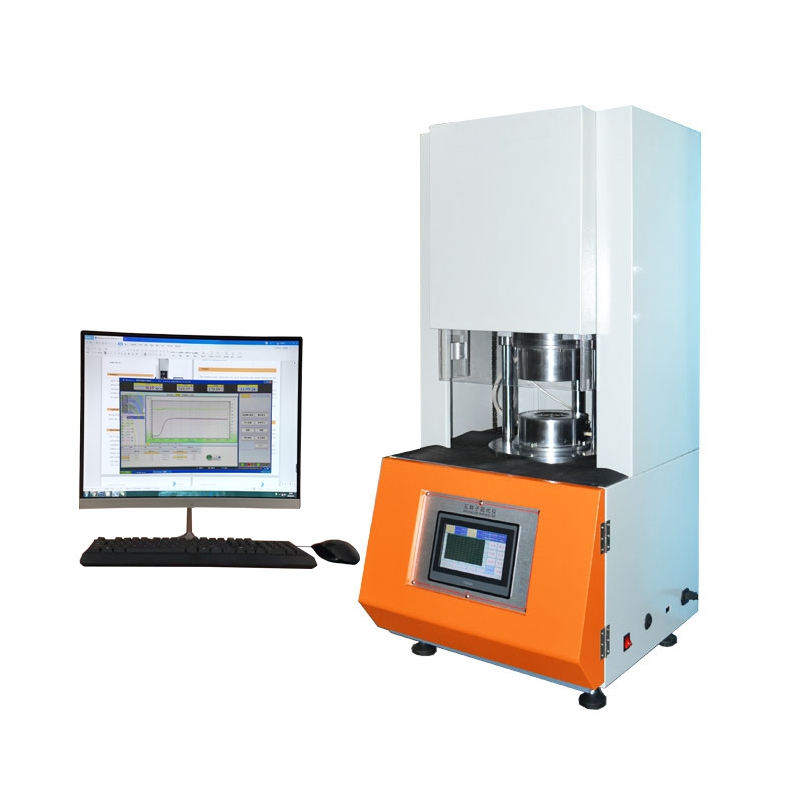
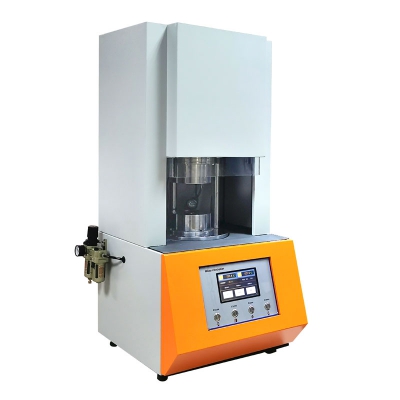
Standards: ASTM-D2084, ASTM-D5289, ISO-6502, ASTM-D1646
Technical parameter:
|
Control temperature range |
Normal temperature~200℃ |
|
Temperature display resolution |
0.01℃ (0.1℃ common type of imported temperature controller temperature) |
|
Temperature control accuracy |
±0.3℃ |
|
Calibration accuracy |
Mooney value ±0.5 |
|
Rotor speed |
2 rotation/ min ±0.02rotation/ min |
|
Torque range |
Mooney value 0~200 |
|
Torque resolution |
Mooney value 0.1 |
|
Print content |
Date, time, temperature, Mooney scorch curve and MV,T5,T35,T3,T18,@15,@30 |
|
Power |
50HZ, ~220V±10% |
Introduction:
Rubber Mooney Viscometer measurement of vulcanization characteristics, requirements, ISO6502
requirements and Italian standards require T10, T30, T50, T60, T90 data.
Feature:
1. the strong data function can support the drawing, storage and output printing of multiple curves under the same interface.
2. it support the data query in many forms and output of excel queries and reports
3. it has many analysis function like statics, deviation setting,standards curve setting, and CPK statistical calculation
4. it has such function as interface query,local zoom and curve comparison.
5. selection of any any vulcanization time,range selection and screen capture.
6. analyzed the past test data once again,and increase or modify the reports, to avoid the loss of data.
7. the test data are stored in the way of database, which is scientist the multiple data sequencing ways are convince for data retrieval and query.
8. the machine will get the characteristic curve and data by measuring the strength of rubber.
9. good reproducible and stasis tics.
Test Results
Measure of Mooney viscosity (Large rotor):
MI -- initial Mooney viscosity.
ML – The minimum Mooney value in the last 30 seconds before the motor stopped.
Mx-t - Mooney value relating to time t.
x-the time of preheat, t-Mooney test time
Stress Relaxation
MRe - Mooney value at the end of stress relaxation.
TRx - time needed for x% torque stress relaxation.
Xy% - % of Viscosity decay after motor stopped y sec.
The value of exponent a, the constant k, the correlation coefficient r, and the area A .
Graph ( with Viscosity-Time curve and Test temperature curve)
Mooney viscosity graph; Relaxation graph; log Mooney units Versus Log time graph.
Scorch Data testing sample results:
-Scorch time curve
-Temperature curve
-Curve index ( Input small or Large Rotor test
MI - initial Mooney viscosity
ML - Minimum Mooney viscosit
MF - Maximum Mooney viscosity in the end of the test
Mx-t - Mooney value relating to time t.
x-the time of preheat, t-Mooney test time
M5/M3 - ML+5/3 Mooney
M35/M18 - ML+35/18 Mooney
t5/t3 - Mooney burning time, M5/M3 corresponding time, Unit: min.
t35/t18 - Mooney vulcanizing time, ML+35/18 corresponding time, unit: min.


